There are 4 types of payroll reports in the system, as listed below:
- Fixed Transactions Report
- Monthly Payroll Reports
- YTD Payroll Reports
- YTD Statutory Payroll Reports
In this entry, I will explain to you the second one - Monthly Payroll Reports. There are five types of reports in this article, the GL Integration report, Monthly Details Report, Monthly Details (Interactive), Period Details Report, and Period Details (Interactive) Report. You may also be interested in the other three articles:
- How to generate a fixed transactions report?
- How to generate YTD payroll reports?
- How to generate YTD statutory payroll reports?
Type 1: GL Integration
Step 1
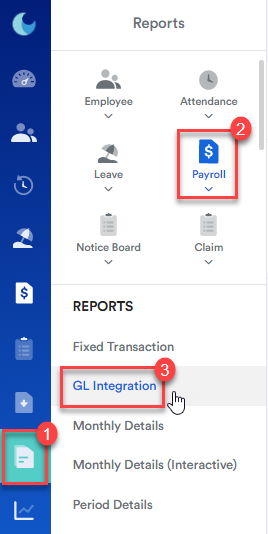
On your homepage, go to your left menu, click on Reports > Payroll, then scroll down to click GL Integration.
Step 2
Choose the Company, Payroll Period, Pay Cycle, and the Pay Method.

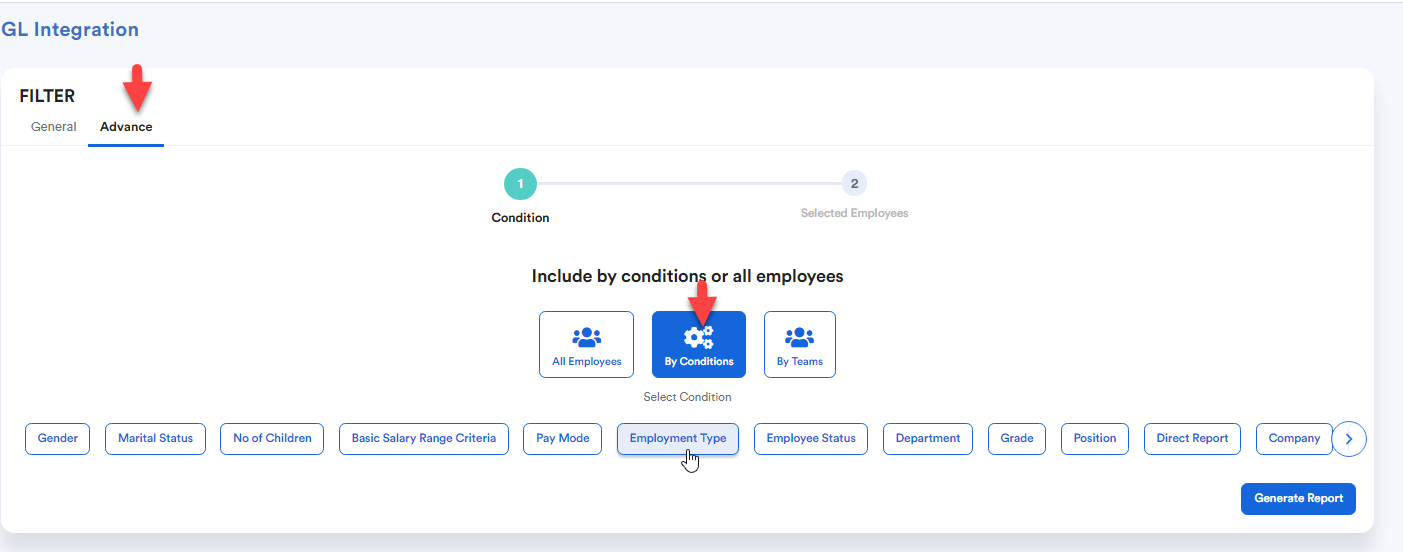
Note: To custom selection, you could also click on Advance alternatively in the previous step. Click By Conditions and select the criteria that you would like to filter by, and click Generate Report.
Step 3
To export to Excel, click on the three vertical dots on the top right, which are above the pivot box as shown below.

Type 2: Monthly Details
Step 1
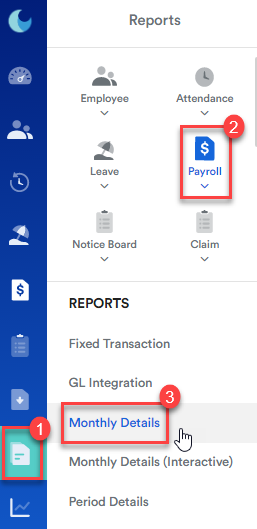
On your left menu, click on Reports(1) > Payroll(2), then scroll down to click Monthly Details(3).
Step 2
Select the payroll period, company, or data group. For the Group By column, you may select None if you would like the report to include all data from the company.

You may then select the Pay Cycle and Payment Date when you scroll further down below. To include the pay cycle and the payment date, click on your selection, and then click on the right arrow button to bring it to the right column, which is the filter for our report. Then, click Generate Report.

Note: To custom selection, you could also click on Advance alternatively in the previous step. Click By Conditions and select the criteria that you would like to filter by, and click Generate Report.

Step 3
To export to Excel, click on the three vertical dots button on the top right, located next to the Filter button.
Type 3: Monthly Details Interactive
Step 1
On your homepage, go to your left menu, click on Reports, go to Payroll, then scroll down to click Monthly Details (Interactive). The main difference between the Monthly Details (Interactive) report to the Monthly Details is that in the former, you can customize the payroll report to pivot certain groups or if you would like to include or exclude certain particular columns from your report.

Step 2
Choose a payroll period then click Generate Report.

Note: To custom selection, you could also click on Advance alternatively in the previous step. Click By Conditions and select the criteria that you would like to filter by, and click Generate Report.

Step 3
To include data in your report, you may click on the boxes as pointed in the arrow in the screenshot below. You can also drag the group data type to the section Row Groups to pivot your data. For example below, I would like the report to be separated by Department.
To export to Excel, click on the three vertical dots on the top right, as pointed out by the cursor in the screenshot below.

Type 4: Period Details
Step 1
Note: The Period Details report acts similarly to the Monthly Details report. However, instead of a typical 12-month payroll cycle, the payroll periods may contain extra or fewer cycles. This is specifically for companies who have set their payroll to be run based on this period rule, as configured under Setting > Payroll > Payroll Period Template. For example, due to the requirement to run a 13-month payroll cycle in a year.
On your homepage, go to your left menu, click on Reports(1), go to Payroll(2), then scroll down to click Period Details(3).

Step 2
Choose the Year, Payroll Period, Payment Date, Company and Grouped by None, if you'd like all data to be included rather than filtered by groups ie. departments. Then click Generate Report.

Note: Clicking on the Subtotal & Grand Total only box located below the filters will only display the subtotal and grand total only without breaking them down into itemized transactions.
Type 5: Period Details Interactive
Step 1
Note: The Period Details Interactive report acts similarly to the Monthly Details Interactive report. However, instead of a typical 12-month payroll cycle, the payroll periods may contain extra or fewer cycles. This is specifically for companies who have set their payroll to be run based on this period rule, as configured under Setting > Payroll > Payroll Period Template. For example, due to the requirement to run a 13-month payroll cycle in a year.
On your homepage, go to your left menu, click on Reports(1), go to Payroll(2), then scroll down to click Period Details (Interactive)(3).

Step 2
Select the Year and then the Payroll Period of choice. Click on Generate Report.

Step 3
To include data in your report, you may click on the boxes as pointed in the arrow in the screenshot below. You can also drag the group data type to the section Row Groups to pivot your data. For example below, I would like the report to be separated by Department.
To export to Excel, click on the three vertical dots on the top right, as pointed out by the cursor in the screenshot below.

Was this article helpful?
That’s Great!
Thank you for your feedback
Sorry! We couldn't be helpful
Thank you for your feedback
Feedback sent
We appreciate your effort and will try to fix the article